文章詳情頁
python - matplotlib 做一個餅狀圖出錯
瀏覽:200日期:2022-06-29 13:41:13
問題描述
def plot_graph(): lables = ’男生比例’,’女生比例’,’其他’ sizes = get_friends_rate() plt.pie(sizes, lables, autopct=’%.3f%%’, shadow=False, startangle=90) plt.axis(’equal’) plt.show()plot_graph()
其中def get_friends_rate()返回return [float(male)/total 100, float(female)/total 100, float(other)/total * 100]運行出現錯誤:
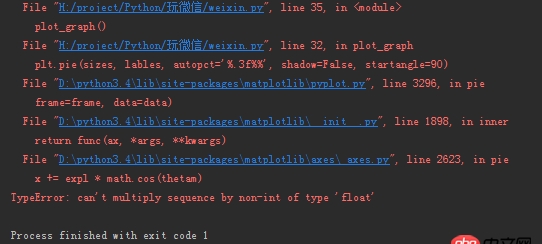
問題解答
回答1:使用了如下的源碼:
>>> from matplotlib import pyplot as plt>>> sizes = 30,20,50>>> lables = u’男生比例’,u’女生比例’,u’其他’>>> plt.pie(sizes, labels=lables,autopct=’%.3f%%’, shadow=False, startangle=90)>>> plt.axis(’equal’)>>> plt.show()
在這里把標簽使用labels參數傳入即可,這里使用的是Python2.7進行編寫。由于是中文,會出現無法顯示的問題。
相關文章:
1. node.js - mongodb查找子對象的名稱為某個值的對象的方法2. docker 17.03 怎么配置 registry mirror ?3. docker 下面創建的IMAGE 他們的 ID 一樣?這個是怎么回事????4. 前端 - @media query 使用出現的問題?5. html5 - datatables 加載不出來數據。6. 運行python程序時出現“應用程序發生異常”的內存錯誤?7. 測試自動化html元素選擇器元素ID或DataAttribute [關閉]8. javascript - QQ第三方登錄的問題9. 利用IPMI遠程安裝centos報錯!10. spring-mvc - spring-session-redis HttpSessionListener失效
排行榜

 網公網安備
網公網安備