Python繪制雷達圖時遇到的坑的解決
ValueError: The number of FixedLocator locations (9), usually from a call to set_ticks, does not match the number of ticklabels (8).
運行書中例題時發(fā)現(xiàn)了這個錯誤,原代碼如上:
import numpy as npimport matplotlib.pyplot as pltimport matplotlibmatplotlib.rcParams[’font.family’]=’simhei’# 某學(xué)生的課程與成績courses = np.array([’C++’,’Python’,’高數(shù)’,’大學(xué)英語’,’軟件工程’, ’組成原理’,’數(shù)字圖像處理’,’計算機圖形學(xué)’])scores=np.array([80,95,78,85,45,65,80,60])datalength = len(scores) #數(shù)據(jù)長度# angles數(shù)組把圓周等分為dataLength份angles = np.linspace(0, #數(shù)組第一個數(shù)據(jù) 2*np.pi, #數(shù)組最后一個暑假 datalength, #數(shù)組中的數(shù)據(jù)量 endpoint=False) #不包含終點scores = np.concatenate((scores,[scores[0]]))angles = np.concatenate((angles,[angles[0]]))# 繪制雷達圖print(angles)print(’=’*20)print(scores)plt.polar(angles, scores, ’rv--’, linewidth=2)# 設(shè)置角度網(wǎng)絡(luò)標簽plt.thetagrids(angles*180/np.pi,courses)# 填充雷達圖內(nèi)部plt.fill(angles,scores,facecolor=’r’,alpha=0.6)plt.show()

自己搜查資料后,了解到,只對socres,和angles做閉合還是不夠
需要再對courses進行閉合
courses = np.concatenate((courses,[courses[0]]))
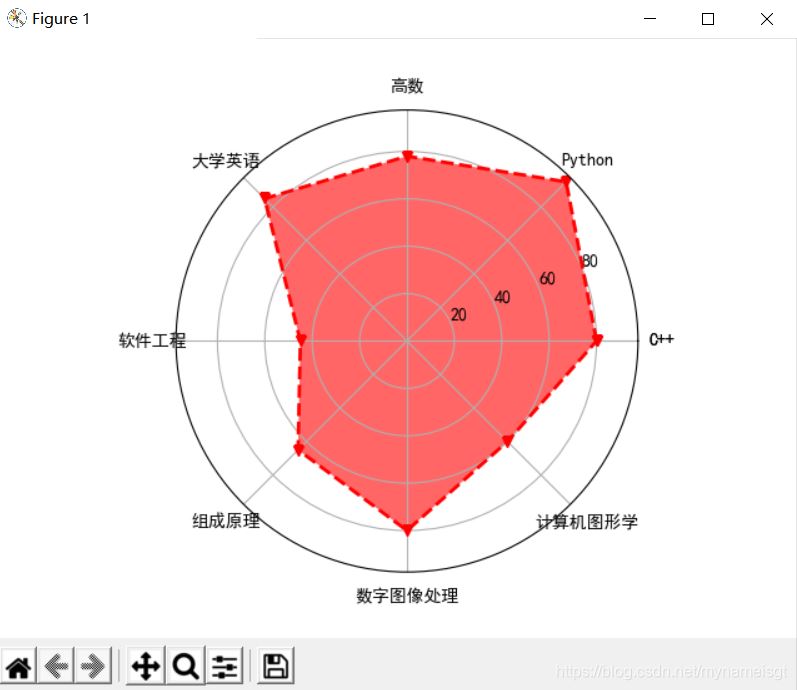
此時就能正確運行出來。
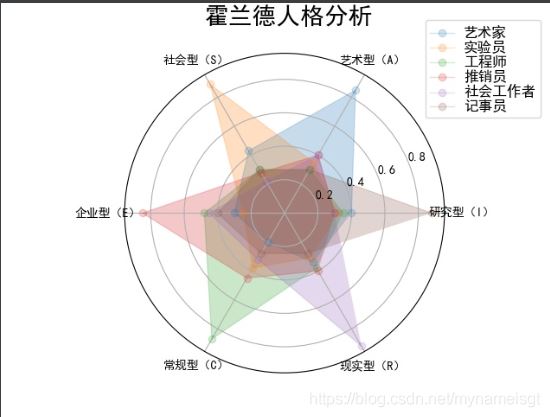
這里在附上霍蘭德人格分析代碼:import numpy as npimport matplotlib.pyplot as pltimport matplotlibmatplotlib.rcParams[’font.family’]='SimHei'radar_labels = np.array([’研究型(I)’,’藝術(shù)型(A)’,’社會型(S)’,’企業(yè)型(E)’,’常規(guī)型(C)’,’現(xiàn)實型(R)’])data = np.array([[0.40, 0.32, 0.35, 0.30, 0.30, 0.88], [0.85, 0.35, 0.30, 0.40, 0.40, 0.30], [0.43, 0.89, 0.30, 0.28, 0.22, 0.30], [0.30, 0.25, 0.48, 0.85, 0.45, 0.40], [0.20, 0.38, 0.87, 0.45, 0.32, 0.28], [0.34, 0.31, 0.38, 0.40, 0.92, 0.28]])data_labels =(’藝術(shù)家’,’實驗員’,’工程師’,’推銷員’,’社會工作者’,’記事員’)angles = np.linspace(0, 2*np.pi, 6, endpoint=False)fig = plt.figure(facecolor = 'white')plt.subplot(111, polar = True)plt.plot(angles, data,’o-’,linewidth=1, alpha=0.2)plt.fill(angles, data, alpha=0.25)plt.thetagrids(angles*180/np.pi, radar_labels)plt.figtext(0.52, 0.95, ’霍蘭德人格分析’, ha=’center’, size=20)legend = plt.legend(data_labels, loc = (0.94, 0.80), labelspacing = 0.1)plt.setp(legend.get_texts(), fontsize=’large’)plt.grid(True)plt.savefig(’holland_radar.jpg’)plt.show()
到此這篇關(guān)于Python繪制雷達圖時遇到的坑的解決的文章就介紹到這了,更多相關(guān)Python繪制雷達圖內(nèi)容請搜索好吧啦網(wǎng)以前的文章或繼續(xù)瀏覽下面的相關(guān)文章希望大家以后多多支持好吧啦網(wǎng)!
相關(guān)文章:
1. 詳解Android studio 動態(tài)fragment的用法2. 解決Android studio xml界面無法預(yù)覽問題3. 圖文詳解vue中proto文件的函數(shù)調(diào)用4. Spring Boot和Thymeleaf整合結(jié)合JPA實現(xiàn)分頁效果(實例代碼)5. php模擬實現(xiàn)斗地主發(fā)牌6. 什么是python的自省7. Vue封裝一個TodoList的案例與瀏覽器本地緩存的應(yīng)用實現(xiàn)8. vue 使用localstorage實現(xiàn)面包屑的操作9. .Net Core使用Coravel實現(xiàn)任務(wù)調(diào)度的完整步驟10. Vuex localStorage的具體使用
 網(wǎng)公網(wǎng)安備